

1. Introduction
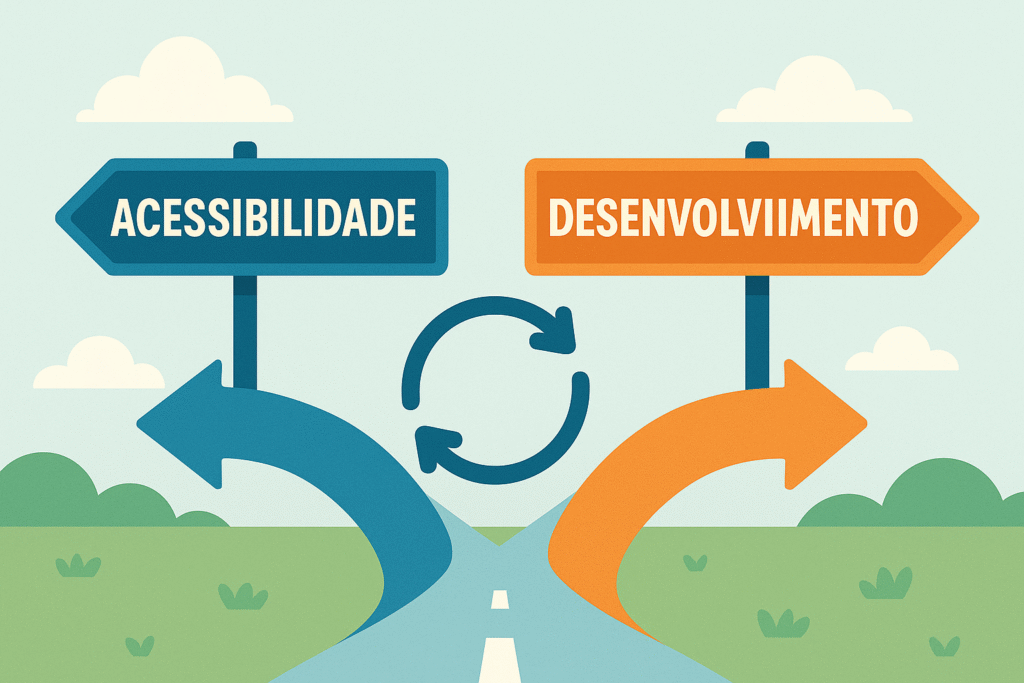
Accessibility, in its dimensions of mobility, urban, digital and social inclusion, and development, whether economic, social or technological, are intrinsically linked. Cities with efficient transport, inclusive infrastructure and accessible technologies tend to provide better quality of life and opportunity, which can drive socioeconomic growth. Conversely, high levels of development can provide the resources and investment needed to implement accessibility improvements. Faced with this “chicken and egg dilemma”, this study seeks to analyze, on the basis of historical data and evidence, whether accessibility drives development or whether it is development that generates improvements in accessibility. The central objective is to examine the direction of that relationship, or whether the two feed each other, in a critical way grounded in indicators from sources such as the UN, the World Bank and IBGE. We will present definitions of the key concepts, opposing schools of thought, case analyses (global and Brazilian) and visualizations (charts and tables) to illustrate trends, providing an accessible understanding of the subject for a general audience.
2. Definitions and concepts
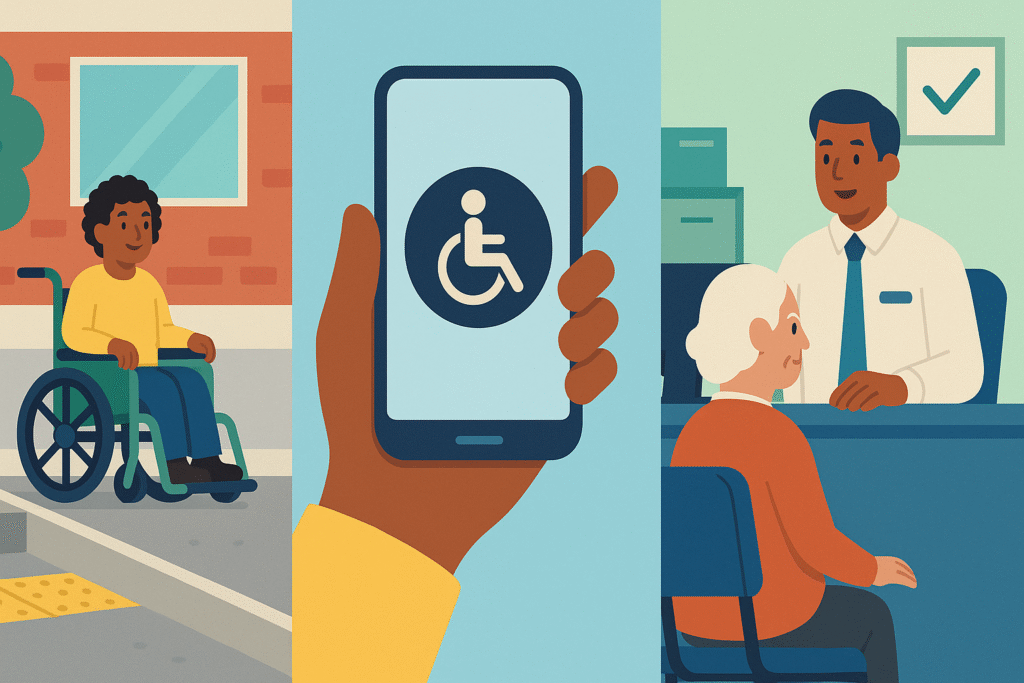
Accessibility: put simply, accessibility is the absence of barriers, guaranteeing equal opportunity for all. It involves enabling people with different abilities (physical, sensory, cognitive) to participate fully in urban and digital life. The concept covers:
- Universal Design: an approach to designing environments, products and services usable by as many people as possible, without the need for specific adaptation. In other words, it means “design for all”, including people with disabilities, regardless of age or condition. For example, ramps instead of stairs alone, visual and audible signals in elevators, websites that work with screen readers: all conceived from the outset to serve diverse users. Projects based on universal design guarantee equal conditions of use from the moment they are conceived.
- Urban inclusion and mobility: this refers to planning cities so that everyone can move around and reach public spaces. It includes accessible sidewalks, adapted public transport (buses with lifts, subway cars with no gap), safe crossings, accessible public restrooms and so on. Urban accessibility is defined as the ease of reaching employment opportunities, health and education services, leisure and green areas. Its level depends both on the efficiency of the transport network and on how those opportunities are distributed across the city. For example, an accessible city has schools, hospitals and jobs close to, or well connected with, housing, reducing travel time and effort for everyone, including people with reduced mobility.
- Digital accessibility: this means ensuring that information and communication technologies (computers, smartphones, apps, websites) are usable by everyone. It involves providing quality internet connection to broad sections of the population (digital inclusion), as well as adopting assistive technology and good design practice (video captions, screen readers for blind users, sign language content for deaf users, simple interfaces for older people, and so on). One example is accessible digital government: online public services with clear language, compatible with assistive technologies, allowing citizens with disabilities to exercise their citizenship without barriers.
- Social inclusion: this concerns integrating historically marginalized groups (people with disabilities, older people, low-income populations and others) into society’s opportunities. Labor market quota policies for people with disabilities, inclusive education in mainstream schools and accessibility programs in cultural spaces (museums, theaters with audio description) are examples of measures that promote social inclusion.
Development: traditionally associated with economic growth (rising GDP, industrialization, urbanization, job and income creation). From that standpoint, a developed society would be one with a strong economy, modern infrastructure and high standards of consumption. Modern approaches, however, broaden the concept to encompass human and sustainable development, including improvement in social indicators (education, health, income distribution), environmental preservation and the strengthening of social capital.
- In the classical paradigm, development was measured by indicators such as per capita income, urbanization rates or industrial output. During the twentieth century, for example, many countries focused on urbanizing and industrializing rapidly, frequently prioritizing economic growth even at the cost of inequality or environmental degradation.
- Sustainable development, consolidated from the Brundtland Commission (1987) and the UN’s Sustainable Development Goals (SDGs, 2015), advocates a balance between economic progress, social justice and environmental conservation. That is, “meeting the needs of the present without compromising future generations”, integrating growth with inclusion and sustainability. A developed city today is therefore not merely wealthy but also inclusive and green.
- Social capital refers to the networks of trust, cooperation and civic engagement within a community. High social capital (for example, communities where people trust one another, take part in associations and help their neighbors) is seen as a factor in modern development, since cohesive societies tend to have better governance, less violence and even greater economic dynamism. One example is how cities with active community participation manage to implement urban improvement projects more effectively, benefiting local development.
In short, in this study we understand accessibility broadly, encompassing physical, informational and socioeconomic access, and development as a multidimensional process. The relationship between them is examined below through different theoretical lenses and practical evidence.
3. Schools of thought and the basis of the arguments
To frame the analysis, we can divide views on the relationship between accessibility and development into two broad schools. The first sees accessibility as an engine of development, that is, improvements in accessibility would cause or catalyze socioeconomic progress. The second sees development as a precondition for accessibility, implying that only after reaching a certain level of development can a society invest broadly in accessible policies. Below we present the arguments of each perspective, supported by data and studies.
A. Accessibility as an engine of development
Advocates of this school argue that investing in accessibility is not only a moral or legal matter: it also brings tangible socioeconomic returns. The logic is that more inclusive environments, services and technologies allow more people to participate actively in the economy and public life, increasing productivity, consumption and overall wealth. Some key points: inclusive infrastructure improves quality of life and productivity. When a city has accessible sidewalks, adapted public transport and buildings with universal design, everyone (with or without disabilities) benefits from easier and safer mobility, resulting in residents who are more economically active and enjoy greater well-being. Studies by Brazil’s Institute of Applied Economic Research (IPEA) indicate that urban accessibility, understood as the ease of reaching jobs, schools, health services and leisure, is correlated with social and economic development in cities. That is because improving access to opportunity reduces inequality and makes fuller use of the human potential available in a region. One concrete example: research on urban transport showed that expanding public transport provision by 10% can raise a city’s GDP by around 1% to 2%, given the greater efficiency in the movement of workers and consumers. In other words, accessibility in mobility generates measurable economic gains.
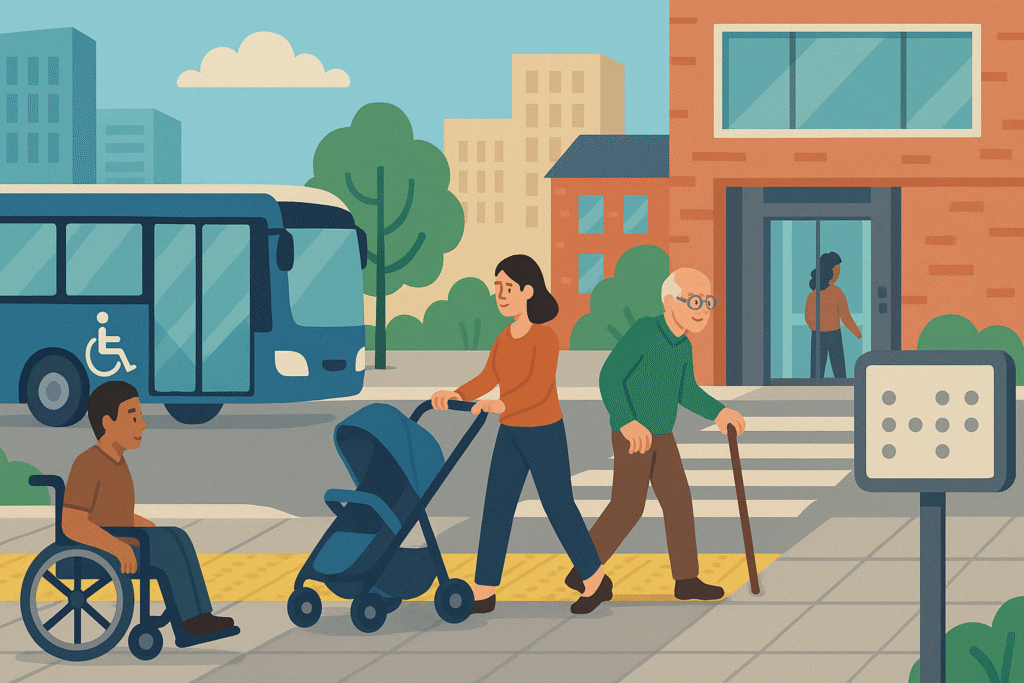
- Accessible urban and digital spaces attract investment and expand markets: Cities and countries that adopt high accessibility standards often become attractive hubs, whether for tourism or for business. A global survey found that accessible tourist destinations are able to capture a growing market of travelers with disabilities and older travelers, driving business for hotels, restaurants and local commerce. Similarly, companies that invest in universal design of their products and services win a larger customer base. Accessible websites, for example, reach not only people with disabilities but also general users who appreciate simple navigation; one cited case was a financial sector company that saw a 20% increase in website traffic after implementing accessibility improvements to its interface. At the macroeconomic level, inclusive countries can have a competitive advantage, since they make better use of the talent of their entire workforce and avoid wasting human capital.
- Data and studies corroborate the positive correlation between accessibility and economic growth: International bodies have been quantifying the impact of including people with disabilities in the economy. According to the World Bank, excluding people with disabilities from the labor market and from consumption can cause a loss of up to 3% to 7% of a country’s GDP. This happens because the lack of accessibility in education and work leads to low employment levels among these people, greater poverty and dependence on benefits. Conversely, including them generates an economic dividend: ILO estimates indicate that countries adopting inclusion policies can significantly increase their GDP by harnessing the participation of this share of the population. Put simply, by removing barriers (in school, in transport, in the digital environment), a currently underused contingent is transformed into productive workers and active consumers, driving growth.
- Practical examples of accessibility driving development:
– Inclusive education: Guaranteeing access for children with disabilities to basic and higher education produces long-term gains, training more qualified people who contribute economically. UN reports show that 15% of children with disabilities worldwide do not attend school; reversing that picture through accessible schools (with trained teachers, materials in Braille and so on) raises the population’s average educational attainment, an indicator strongly associated with a country’s development.
– Assistive technology and innovation: Investment in assistive technology (low-cost prostheses, voice software, accessibility apps) can stimulate high-technology and innovation sectors, creating new products and startups. Countries that become hubs for inclusive technologies (such as hearing aids, screen readers, accessible autonomous vehicles) reap economic benefits by exporting those solutions globally. Moreover, innovation generated to serve people with disabilities often benefits the whole of society, a phenomenon known as the curb cut effect. For example, the development of voice control on smartphones, conceived for people with motor or visual difficulties, ended up becoming widely popular through virtual assistants, driving new markets. That cascade effect of accessibility drives productivity and growth in an indirect but powerful way.
– Work and income: Accessible workplaces (physical and digital) allow more people to enter the formal labor market. Inclusive companies report performance gains: there is evidence that companies prioritizing diversity and inclusion (including people with disabilities) have on average 28% more revenue and double the net income, according to studies compiled by the World Economic Forum. These positive results encourage further investment and demonstrate that accessibility is also good for business.
In summary, the view of accessibility as an engine of development holds that inclusive policies generate a virtuous cycle: by enabling broad social and economic participation (especially by previously excluded groups), society grows richer, not only financially but in human capital and social cohesion, which in turn feeds further improvements. In the words of a Portulans Institute report, when we ignore the challenges of the most vulnerable, those challenges become a brake on growth; but by tearing down barriers and building accessible paths to success, everyone wins.
B. Development as a precondition for accessibility
The opposing school argues that the relationship runs mainly the other way: a certain level of development must first be reached in order to make accessibility viable at scale. From this point of view, full accessibility is the result of prosperous societies that can afford, or have the institutional capacity, to invest significant resources in adaptations, assistive technologies and specialized infrastructure. The main arguments include:
- Economic growth makes public and private investment in accessibility possible: Introducing adapted buses, resurfacing sidewalks, installing elevators in old subway stations, developing inclusion software: all of these actions demand financial resources and technical capacity. Developing countries or cities frequently struggle to provide even basic services, so priorities such as accessibility end up postponed until there is budget room. Historically, nations first grow rich and urbanize, then turn their attention to making that development more inclusive. The Scandinavian countries, for instance, today benchmarks in urban and digital accessibility, only undertook massive efforts in that area from the 1970s and 1980s, when they already enjoyed high GDP per capita and broad social welfare. In general, developed regions tend to have better accessibility indicators, whether in transport, buildings or digital connectivity, precisely because they have more resources for those purposes. One simple indicator: in 2022, more than 90% of the population of high-income countries used the internet, while in low-income nations only around 25% had access. That enormous digital disparity shows how economic development (national income) is linked to infrastructure and digital inclusion.
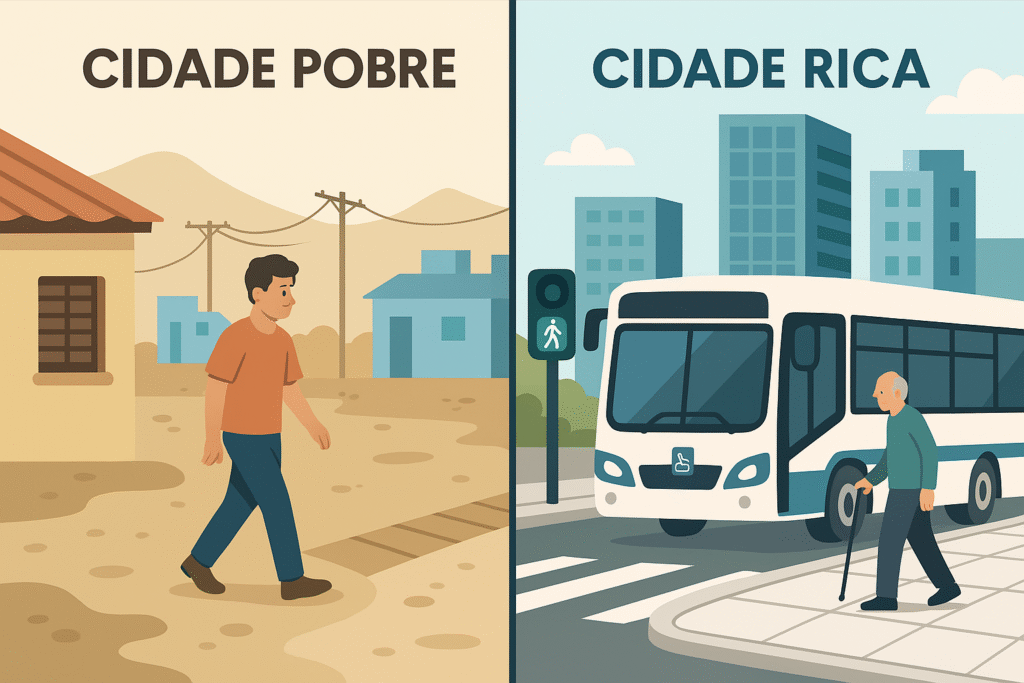
This difference suggests that only after reaching an advanced level (in this case, high income) do countries manage to connect almost their entire population. The lack of investment in telecommunication networks and in digital literacy in poor countries keeps a large share of their inhabitants excluded from the internet, which in turn limits them economically, a cycle that is hard to break without initial growth.
- More developed regions and groups lead accessibility improvements: Within the same country, localities with greater human and economic development usually have better accessibility. In Brazil, for example, states with higher HDI and per capita income generally have more adapted infrastructure: cities in the South and Southeast (wealthier) tend to have standardized sidewalks, audible traffic signals, greater internet access and inclusion programs, compared with many cities in the North and Northeast (poorer). IBGE itself revealed regional differences: the Northeast, the least economically developed region, has the highest prevalence of people with disabilities (10.3% of the population) and also the lowest rates of participation of these people in the labor market (26.8%), while the Center-West (economically more dynamic) has the highest inclusion of people with disabilities in the workforce (35.7%). That contrast indicates that where there is less development, accessibility faces greater challenges, reinforcing the idea that development is a prerequisite for inclusion (since the Northeast, with fewer resources, invests and includes less). In addition, populations in better individual socioeconomic conditions can fill accessibility gaps privately: wealthy families can adapt their homes, buy imported assistive equipment and pay for adapted private transport, while low-income families depend exclusively on public policy (which in poor areas is scarce). General economic and social progress therefore ends up being the condition for demand and pressure for accessibility to emerge, as well as the means to supply it.
- Accessibility legal frameworks emerge in contexts of greater institutional development: Another point is that accessibility laws and standards tend to be drawn up and implemented when a society reaches a certain degree of political organization and civic awareness, something generally associated with a level of development. The UN Convention on the Rights of Persons with Disabilities (CRPD), which promotes broad inclusion, was ratified mainly by countries that already had stable democracies and economies. In Brazil, the Brazilian Inclusion Act (LBI), the comprehensive legal framework on the rights of people with disabilities, only came into force in 2016, a decade in which the country was already considered upper-middle income and had seen improvement in social indicators. Until then, even with some rules in place (such as Decree 5,296/2004 on architectural accessibility), enforcement was limited. This illustrates that accessibility improvements often “follow” development gains: first access to education expands, the middle classes grow and social participation strengthens; then organized groups demand rights, and the state has the resources and stability to legislate and enforce inclusion standards. In very poor or conflict-affected countries, unfortunately, the accessibility agenda rarely gains political traction.
- Evidence of correlation between level of development and investment in accessibility: Various data point to correlations such as: countries with higher GDP per capita have higher percentages of accessible public buildings, transport systems with a lower average fleet age (newer and generally accessible buses and trains), and greater penetration of assistive technologies. According to an ITU and World Bank report, people in high-income countries have not only more internet access but also better-quality access (high speeds, broadband), while in low-income countries, even the few who are connected face poor connection quality. This demonstrates that technological and economic development provides the material basis for digital inclusion. Likewise, health indicators show that developed countries are able to invest in prevention and rehabilitation, reducing or delaying disability; in less developed countries, unmet disability prevails (for example, a lack of vaccination or prenatal care produces more cases of childhood disability). At an early stage of development, a society therefore deals with high basic demands (reducing mortality, hunger, illiteracy) and only as it progresses can it allocate resources to eliminating architectural barriers, deploying cutting-edge accessibility technologies and so on.
- Criticism of the simplistic view that “the rich have accessibility, the poor do not”: Although the correlation exists, it is important to note that development alone does not automatically guarantee accessibility. Economic growth without inclusion is possible: unequal development. Some very wealthy oil-producing countries, for example, grew rich quickly but without equivalent inclusive structures (often for want of political priority). Academic studies suggest that income share is not the sole determining factor of accessibility, meaning that merely raising a region’s income does not ensure it will improve in accessibility if there are no intentional policies. That nuance is discussed further below (Complementary Perspectives). In general, however, this school emphasizes that a certain level of economic and social development is a practical precondition for implementing accessibility at scale: in the early stages, societies would struggle to prioritize and fund such initiatives.
To summarize this view: development creates the conditions for accessibility, whether by providing financial resources, generating technical knowledge or building social pressure for inclusion. Public policy efforts should therefore first focus on promoting growth and basic human development; accessibility would come as a natural consequence or a subsequent stage of that progress. An illustrative adage would be: “First bake the cake (development), then share it equally with everyone (accessibility)”, emphasizing the causal sequence in which the cake needs to exist (wealth and structure must be there) before it can be shared inclusively.
4. Complementary perspectives and critical debate
As often happens with complex subjects, the two schools above are not mutually exclusive. In fact, accessibility and development form a dynamic relationship of mutual reinforcement. Various specialists argue that an integrated view is needed, recognizing that accessibility and development influence one another in a cycle. Some points of debate and synthesis:
- Positive feedback (virtuous circle): Accessibility and development can advance together in an upward spiral. For example, a city that invests in accessible public transport allows more people to study and work (including those previously excluded), which raises productivity and local GDP; that economic growth generates more tax revenue, which in turn allows new investment in accessible infrastructure, closing a virtuous circle. Inclusive development generates more development. World Bank reports on Latin America observe exactly that: pure economic growth alone is not enough to reduce existing inequalities. Marginalized groups must be actively included for development to be sustainable. When that happens (for example, when people with disabilities are able to qualify and enter the market), they contribute to the reconstruction and growth of countries, making development more robust. In short, making development accessible to everyone multiplies its overall benefits.
- Risk of negative feedback (vicious circle): Conversely, the lack of accessibility can trap societies in low development, and low development makes it harder to improve accessibility: a vicious circle. Underserved populations (for example, people with disabilities without education or work) remain in poverty, representing a social burden rather than a productive force, and poverty generates more disability (through a lack of health care, unsafe work and so on). That phenomenon, disability and poverty feeding one another, is documented globally and in Brazil. If a country does not break that cycle with deliberate policy, it can become stuck: without inclusion there is no full development, and without the resources of development there is no way to promote inclusion. The criticism here is that waiting to “get rich in order to include” may be a strategic error, since continued exclusion holds back the very growth being sought. Many middle- or low-income countries that adopted inclusive policies have reaped the benefits (for example, the educational inclusion of minorities in the United States after the war contributed to the economic boom of the following decades). From a critical standpoint, investment in accessibility is therefore necessary even in contexts of scarce resources, in order to break the vicious circle; otherwise, development will be incomplete and fragile.
- Examples of partial dissociation between wealth and accessibility: Countries or cities with similar income levels can display very different degrees of accessibility, suggesting that cultural, political and institutional factors weigh heavily. Tokyo and New York, for example, are developed megacities; both have century-old subways. Tokyo invested heavily in modernization and today has extensive accessibility in transport (elevators, tactile paving, universal signage), while New York still struggles to adapt many of its old subway stations. This shows that the priority given to the subject and administrative continuity are crucial: economic development is a necessary but not sufficient condition. In Brazil, we can compare cities: Curitiba (Paraná) and Manaus (Amazonas) have GDP per capita that is not so far apart, but Curitiba is a benchmark in inclusive urban planning (an integrated network of accessible buses, standardized sidewalks) while Manaus faces basic infrastructure challenges. Intentional public policy and urban planning therefore determine whether development will translate into accessibility for everyone. Without political will, growth can occur in an exclusionary way (benefiting only those who already had no limitations). That is a frequent criticism: “blind” development can deepen inequality if there is no focus on inclusion.
- Intersections with sustainability and equity: Developing with accessibility is aligned with the principles of sustainable development and social justice. In the current debate, it is argued that there is no true development if parts of society remain excluded. Modern development indicators, such as the Human Development Index (HDI) or the SDGs themselves, incorporate measures of inclusion. SDG 11 (Sustainable Cities), for example, carries explicit targets on access for all to safe, accessible and sustainable transport. This reflects the emerging global consensus that accessibility is not a luxury but an integral part of quality development. “Smart city” models today include digital and architectural accessibility as essential criteria. The dichotomy between accessibility and development therefore tends to dissolve into a concept of inclusive development, which covers both simultaneously.
- Data limitations and the need for better metrics: One difficulty highlighted in the debate is the lack of consistent data on accessibility, especially in developing countries. The absence of indicators often means challenges go unnoticed or underestimated. Without data, it is hard to prove a causal relationship and to argue for budget for accessible initiatives. Fortunately, this is changing: IBGE, for example, included a specific module on people with disabilities in the 2022 Continuous PNAD survey, revealing important disparities in Brazil (detailed below in the In Brazil chapter). Internationally, bodies such as the UN and the World Bank have emphasized disability-disaggregated data and created accessibility indices. That improvement in the evidence base will allow more robust analysis in future of how much accessibility drives development and vice versa, and which strategies work best.

In summary, the critical debate indicates that accessibility and development should be pursued jointly and in a coordinated way. Rather than seeing a hierarchy (one coming before the other), the contemporary view suggests integration: development policy needs to incorporate the accessibility dimension from the planning stage (mainstreaming), while accessibility policy should be defended even in low-resource scenarios for its potentially transformative effect. Adopting that integrated approach minimizes the risk of leaving groups behind, honoring the SDG mantra of “leaving no one behind”, and maximizes the potential for inclusive growth.
5. Methodology and use of data
This study adopts a mixed qualitative and quantitative approach to investigate the question posed. The following methodological steps and data sources were used:
- Bibliographic and documentary research: Research was carried out in reports from international organizations (UN, World Bank, World Health Organization) and in academic literature on accessibility and development. That review made it possible to identify theories (such as the schools presented) as well as global statistical data. For example, we used UN reports on disability and development (2018), World Bank documents focused on inclusion in Latin America, and IPEA and IBGE studies in the Brazilian context. Triangulating sources gives robustness to the arguments and avoids the biases of a single institution.
- Comparative quantitative data: Key indicators capturing aspects of accessibility and of development were compiled in order to check correlations and trends. Among them:
Internet access rates versus countries’ per capita income (source: World Bank/ITU), already highlighted in the previous section, illustrating the disparity between high- and low-income countries.
- Statistics on the economic participation of people with and without disabilities (source: IBGE and World Bank), for example the percentage of people with disabilities in employment, educational attainment levels and average income, compared with the general population, in order to measure the inclusion gap. These figures show how far this group’s potential is used or wasted in different societies.
- Investment in accessible urban infrastructure versus GDP or HDI, obtained from case studies, such as municipal budgets allocated to sidewalks and universal transport in cities with differing HDI.
- Development indicators (HDI, GDP per capita, urbanization rate) versus accessibility indicators (percentage of accessible public buildings, existence of specific legislation and so on) in different countries, in order to identify general patterns.
- Methodological limits: It is worth noting that establishing direct causality is challenging. Although we use terms such as “drives” or “conditions”, the data here is largely correlational. There are always multiple intervening factors (political, cultural) that are impossible to isolate completely. This is therefore not about mathematically proving a single causal relationship, but about interpreting a broad body of evidence to infer probable directions of influence. Another limitation was the uneven availability of accessibility data. We often had to rely on proxies (such as the participation of people with disabilities in the labor market as an indication of inclusion, or internet access as an indication of digital inclusion). These limitations are acknowledged and strengthen the recommendation to improve the collection of accessibility data in future.
In short, the methodology rests on data from reliable sources and analytical triangulation. We now turn to the concrete results of that analysis, presenting a final synthesis and future perspectives, along with a chapter dedicated to the Brazilian context, which applies this global discussion to our local reality, with figures from IBGE and national initiatives.
6. Conclusion and future perspectives
Having examined the arguments and the evidence, it is clear that accessibility and development have a symbiotic relationship: each influences the other in multiple respects. There is no simple, one-directional answer of the “one brings the other” kind. On the contrary, full societal progress requires simultaneous advances in inclusion and in socioeconomic growth. We can summarize the main insights obtained:
- Accessibility drives development, and vice versa: Investing in accessibility means investing in people, releasing human potential that is currently underused, which stimulates innovation, expands markets and strengthens the economy. At the same time, without a base of development (resources, institutions), such investment rarely occurs at scale. Effective public policy must therefore integrate accessibility into development strategies from the start, avoiding the trap of waiting for wealth in order only then to include. Development that ignores accessibility will be unequal and incomplete, wasting up to 7% of GDP according to estimates, while development committed to inclusion tends to be more sustainable and robust.
- A virtuous circle to be fostered: The positive examples demonstrate a win-win equation: cities and countries that promoted inclusion reaped substantial economic and social benefits. Whether in the digital economy (where including more users generates more innovation), urban mobility (where accessible transport reduces congestion and increases overall efficiency) or education (where inclusive schools raise the average level of human capital), there is strong evidence of positive returns. That finding should guide policymakers to see spending on accessibility not as a cost but as a strategic development investment. Every ramp built, every assistive system deployed, every quota policy fulfilled can mean fewer people dependent on assistance and more people who are productive and engaged.
- The importance of integrated public policy: Isolated strategies are not enough: cross-sector approaches are required. For example, there is no point in providing vocational training to a person with a disability if public transport or the office building is not accessible enough for them to work; likewise, equipping buses with lifts is excellent, but if the sidewalks leading to the stop are poor, many users will remain excluded. Governments must therefore create comprehensive plans: inclusive urban planning + inclusive education + inclusive employment + inclusive technology, all moving together. Models such as universal design provide guidelines for integrating those aspects at the root of projects. Moreover, involving communities and the beneficiaries themselves in planning usually leads to more effective and creative solutions, increasing buy-in and optimizing resources.
- Future perspectives and recommendations:
– Data and monitoring: It is crucial to improve the collection of accessibility data. National surveys (such as IBGE’s PNS or PNAD) should continue measuring the situation of people with disabilities, mobility, digital access and so on regularly, making it possible to track progress or setbacks. Specific accessibility indicators should form part of development indices. This will help calibrate policy and allocate resources where the inclusive cost-benefit ratio is greatest.
– Technology and innovation: The future brings opportunities for leaps in accessibility through technology. Autonomous vehicles, for example, can offer mobility to blind people and to those who do not drive; 3D printers can make prostheses cheaper; artificial intelligence can improve voice readers and real-time sign language translation. It is fundamental that developing countries also access and adopt these innovations, shortening paths that would take decades by traditional means. International partnerships and the private sector will play a central role here.
– Awareness and culture: Beyond physical works and technologies, there is a cultural aspect. Genuinely inclusive societies value diversity and eliminate prejudice, which in turn makes it easier to implement accessibility measures (because there is public support). Awareness and education campaigns about the rights of people with disabilities, population aging and empathy generate social capital in favor of inclusion, making it part of the “DNA” of development.
– Smart financing: Countries and municipalities should take advantage of innovative financing mechanisms for accessibility: international funds (such as the UN’s Accessible Cities program), public-private partnerships to adapt heritage buildings, tax incentives for companies that invest in accessibility (such as exemptions on the purchase of domestically produced assistive equipment), among others. The initial cost is often intimidating, but appropriate financing models dilute the impact and guarantee the sustainability of these initiatives.
In conclusion, we can state that the question posed, “does accessibility bring development, or does development bring accessibility?”, has a two-way answer: quality development should bring accessibility, and more accessibility will certainly bring more quality development. The challenge for governments and society is to break vicious cycles of exclusion and turn them into virtuous cycles of inclusion and shared prosperity. The data and arguments presented emphasize the need to treat accessibility not as a separate topic but as a central component of development plans from here on. Only then will we reach a level of civilization in which economic growth, social equity and respect for difference advance together, enriching one another.
7. In Brazil
Let us now turn to the Brazilian reality, exploring how accessibility and development relate to one another, based on data from IBGE and other national sources, and comparing this with the global context. Brazil offers an interesting picture: it is Latin America’s largest economy, with an upper-middle income level, yet marked by significant regional and social inequality, including in the inclusion of people with disabilities and in urban and digital accessibility.
General IBGE data on people with disabilities in Brazil: according to the 2022 Continuous PNAD survey, Brazil had around 18.6 million people with some form of disability (8.9% of the population aged 2 or over). That percentage is lower than the global average (~15%), but definitions vary; in any case, it is a substantial share of the population (almost 1 in every 10 Brazilians). The distribution by type of functional difficulty varies: the most frequent relate to difficulty walking (3.4% of the population), difficulty seeing even with glasses (3.1%) and difficulty learning or concentrating (2.6%). The prevalence of disability rises sharply with age: 47.2% of people with disabilities are aged 60 or over, reflecting population aging and indicating that accessibility will become increasingly critical in the coming decades (since the older population is growing). There is also regional variation: the Northeast records the highest proportion of people with disabilities (10.3%) and the Southeast the lowest (8.2%), possibly for socioeconomic reasons (higher poverty rates and poorer health conditions in the Northeast lead to more disabilities acquired over the course of life).
Development inequalities translate into inclusion inequalities: IBGE data lays bare marked disparities between people with and without disabilities in practically every socioeconomic indicator. This reinforces the thesis that a lack of accessibility and inclusion is linked to lower human development for that group. Let us look at some key points from the 2022 survey:
- Education: The educational attainment of people with disabilities is far lower than that of the rest of the population. The illiteracy rate among people with disabilities aged 15 or over is 19.5%, while among people without disabilities it is only 4.1%. In other words, almost 1 in every 5 Brazilians with a disability is illiterate, a rate equivalent to that of Brazil in the 1980s, showing how far this segment has fallen behind educationally. Moreover, only 25.6% of people with disabilities completed at least secondary education, compared with 57.3% of people without disabilities. At higher education level, the disparity is also wide: only 7.0% of people with disabilities hold a university degree, against 20.9% of those without. These figures indicate significant barriers in access to education, whether through a lack of accessible schools, a shortage of support (such as sign language interpreters and adapted materials), or dropout caused by ableism and mobility difficulties. Even though laws such as the LBI guarantee accessibility resources in education, in practice many students with disabilities remain out of school or learn less than they could. That low educational qualification limits their employment and income opportunities, closing a cycle of lower individual development.
- Labor market: The differences sharpen in adult life. In the third quarter of 2022, the labor force participation rate (people working or seeking work) among people without disabilities was 66.4%, while among people with disabilities it was only 29.2%. In other words, fewer than a third of working-age people with disabilities were in the labor market, against two thirds of the rest: an enormous gap. Even among those with higher education, participation was 54.7% (people with disabilities) versus 84.2% (without disabilities), showing that not even high educational attainment eliminates the difference, possibly because of discrimination or workplaces that are not accessible. The employment rate (percentage actually in work) was 26.6% for people with disabilities versus 60.7% for people without. In other words, of every four working-age people with disabilities, only one was actually working. Among Brazil’s total employed population, only 4.7% were people with disabilities, while they represent around 8.9% of the population, indicating clear under-representation in employment. In addition, most people with disabilities who do work are in more vulnerable positions: 55.0% of employed people with disabilities are in informal work, versus 38.7% of employed people without disabilities. There is also greater concentration in self-employment (36.5% of people with disabilities versus 29.0% of people without, in the case of men), possibly because working for oneself sometimes gets around doors closed in formal employment. These data show that the lack of accessibility in the world of work and lower educational attainment result in economic exclusion, with people with disabilities having far less access to formal jobs and remaining more often in precarious occupations. Consequently, their income levels are lower.
- Income: The average monthly earnings of an employed person with a disability are around 30% lower than the national average. In 2022 values, people with disabilities earned an average of R$1,860 a month, against R$2,690 for people without disabilities. That disparity reflects, in addition to lower educational levels, possible wage discrimination and the fact that they are in informal or less well-paid work. Gender inequality compounds it: women with disabilities earned an average of R$1,553, well below men without disabilities (R$2,941). With lower income and labor participation, people with disabilities are more likely to depend on social benefits or on family, which can limit their full development and social inclusion.
- Quality of life indicators: Living conditions also differ. Although the 2022 IBGE survey does not address all of them directly, earlier research showed, for example, lower rates of access to healthcare and a higher incidence of poverty among families with people with disabilities. One figure cited by the World Bank for Latin America is that one in every five households in extreme poverty has a member with a disability, illustrating the link between disability and socioeconomic vulnerability. In Brazil, the BPC (Continuous Cash Benefit) serves millions of people with disabilities living in extreme poverty, which confirms that correlation.
These numbers clearly show that, in Brazil, people with disabilities have been left behind in the development process. Lower education, employment and income indicate lower human development for that group, which also represents a brake on national development (fewer people producing wealth, more demand for assistance). There is therefore ample scope and need for action to break that cycle.
Brazilian policies and initiatives: Brazil has a relatively advanced legal framework in favor of accessibility. Beyond the LBI (Law 13,146/2015), which guarantees rights in education, transport, work and communication and imposes accessibility standards, there are earlier laws such as the Quota Law (Law 8,213/1991), which requires medium and large companies to reserve between 2% and 5% of their positions for people with disabilities. There are also Brazilian technical standards (ABNT NBR 9050) detailing architectural accessibility requirements. Many cities have Municipal Councils for People with Disabilities that take part in local policy. Programs such as “Viver sem Limite” (Living without Limits, launched in 2011) sought to coordinate action across various areas, and there was an expansion of rehabilitation centers (the SUS Care Network for People with Disabilities).
The challenge in Brazil, however, is the effective and uniform implementation of these policies in a continental and unequal country. Some advances are notable: for example, practically 100% of the urban bus fleet in capitals such as São Paulo and Curitiba already has lifts or low floors; new buildings follow accessibility standards more closely; the presence of sign language interpreters on television and at events has become common; in schools, children with disabilities have come to be included in mainstream classes (the number of students with disabilities in mainstream schools grew considerably over the past decade). Nevertheless, structural problems persist: potholed sidewalks, a lack of tactile and audible signage in many cities, insufficient public transport in rural areas, old government buildings with no adaptation, a low supply of accessible books and so on. In addition, compliance with the Quota Law in the labor market is not always complete: many companies claim difficulty finding qualified candidates, which points once again to the educational deficit.
Comparing globally, Brazil is halfway: it has not reached the level of accessibility of developed countries, but it has policies and social awareness superior to many countries of equivalent income. In digital accessibility, for example, Brazil has hosted international conferences and several companies adopt WCAG guidelines on their websites; yet in practice, 61% of households connected to the internet (2017) is still low, and there is a chasm between social classes in access. In urban planning, Brazilian cities rank in the middle in accessibility rankings, far behind European cities but better than metropolises in poorer countries.
Illustrative national examples:
- Urban planning: Curitiba, the benchmark already cited, is reaping the economic results of decades of inclusive transport planning. Other cities that grew in a disorderly way now suffer from congestion and a lack of mobility for everyone, which affects their productivity.
- Domestic assistive technology: Brazil produces some assistive technologies (such as motorized wheelchairs and software like DOSVOX for blind users). Investing in that sector could generate local innovation and exports. Here we see how technological development can both help accessibility and be driven by it.
- Inclusive education: The state of Ceará, despite being poor, has successful experiments in inclusive education with UNICEF support, showing that even in a context of low GDP per capita, good practice can improve educational access for students with disabilities, translating into better indicators in future. This reinforces the point that political will and efficient management can mitigate resource constraints, breaking the notion that only the wealthy can pursue inclusion.
Challenges and routes for Brazil: Brazil needs to reconcile its development effort with the reduction of inequalities in accessibility. Some important directions: expanding accessibility in transport and public spaces in all cities (not only state capitals); strengthening inclusive education from early childhood (training teachers, providing multifunctional resources in schools); fostering vocational qualification for people with disabilities so that they occupy higher-income positions (tackling the root of non-hiring, which is often a lack of training); using the state’s purchasing power to require accessibility (contracting only accessible companies, for example); and running campaigns that change perceptions, since many people with disabilities report that the attitudinal barrier is as damaging as the physical one.
In global comparison, Brazil, as the world’s ninth largest economy, is in a position to lead the inclusive development agenda in Latin America. The Brazilian experience, if the country manages to implement its laws fully, could serve as a model for neighboring middle-income countries. For now, we still face contradictions: legal advances and some successful programs versus the daily reality of millions with limited access.
Returning to the central question in the Brazilian context: does accessibility bring development, or does development bring accessibility? Here too we see it is a two-way street. IBGE data suggests, for example, that where there was more development (South and Southeast), there was somewhat more inclusion, but it also reveals that the lack of inclusion held back the development of part of the population (people with disabilities). Brazil will only achieve full development (and the SDG targets) if it manages to integrate accessibility into its growth agenda. In practice, that means turning excellent laws into concrete practice, with budget and enforcement, so that every person, whatever their limitations, can study, work, consume, get around and interact freely.
The In Brazil chapter therefore shows us both the costs of exclusion (millions out of the market, lower earnings, wasted talent) and the potential gains of inclusion (if the education and employment rates of people with disabilities matched the average, we would have millions more workers and students, raising national productivity and income). In a country seeking economic growth with social justice, it is evident that accessibility is not a segmented issue but part of the solution for development. Definitively integrating these agendas is the challenge and the opportunity before Brazil in the years ahead.
The Brazilian experience reaffirms the need to leverage accessibility as an instrument of development. The question posed in the title is particularly relevant for us: we must promote inclusion and growth simultaneously. If “accessibility brings development”, we should see it as an urgent investment; and “development brings accessibility” reminds us not to neglect inclusion as we advance economically. So that in the near future we can say that Brazilian development, as well as being high in the numbers, is genuinely development for everyone, leaving no one on the margins.

Bibliographic references and data sources:
- Banco Mundial, “Inclusion of Persons with Disabilities in Latin America and the Caribbean: A Path to Sustainable Development”, 2021 (Inclusion of Persons with Disabilities is Crucial for the Sustainable Development of Latin America and the Caribbean) (Inclusion of Persons with Disabilities is Crucial for the Sustainable Development of Latin America and the Caribbean) (Inclusion of Persons with Disabilities is Crucial for the Sustainable Development of Latin America and the Caribbean).
- IBGE, Pesquisa Nacional por Amostra de Domicílios Contínua 2022: Pessoas com Deficiência – Agência de Notícias IBGE, 07/07/2023 (Pessoas com deficiência têm menor acesso à educação, ao trabalho e à renda | Agência de Notícias) (Pessoas com deficiência têm menor acesso à educação, ao trabalho e à renda | Agência de Notícias) (Pessoas com deficiência têm menor acesso à educação, ao trabalho e à renda | Agência de Notícias).
- IPEA, Projeto Acesso a Oportunidades – Nota Técnica IPEA 2020 (IPEA: A acessibilidade urbana é fator de desenvolvimento social e econômico – Envolverde).
- Portulans Institute, “The high cost of exclusion and what we need to do about it”, 2020 (The high cost of exclusion and what we need to do about it – Portulans Institute).
- ONU Brasil, “Primeiro relatório da ONU sobre deficiência e desenvolvimento aponta lacunas na inclusão”, 2018 (Primeiro relatório da ONU sobre deficiências e desenvolvimento aponta lacunas na inclusão | As Nações Unidas no Brasil) (Primeiro relatório da ONU sobre deficiências e desenvolvimento aponta lacunas na inclusão | As Nações Unidas no Brasil).
- World Health Organization & World Bank, World Report on Disability, 2011.
- BNDES, “Expansão da infraestrutura de banda larga no Brasil” – Blog do Desenvolvimento, 2019 (Agência BNDES de Notícias – Expansão da infraestrutura de banda larga no Brasil).
- KIMBO Design Blog, “The Economic Benefits of Accessible Urban Design”, 2024 (The Economic Benefits of Accessible Urban Design) (The Economic Benefits of Accessible Urban Design).
- Stanford Social Innovation Review, “The Curb-Cut Effect”, 2017 (The Curb-Cut Effect).
Make accessibility a decision, not a detail
If accessibility drives development, the question is no longer whether to invest, but where to start.
The Guiaderodas Certification goes beyond a technical checklist. Its methodology combines a detailed assessment of the physical space, the lived experience of people with disabilities, staff training for an accessible attitude and a leadership commitment to continuous improvement.
Learn about the Guiaderodas Certification →